03 Aug Using the OpenGL Profiler with OpenFrameworks (Or Cinder, Processing, etc etc.)
The OS X OpenGL Profiler is a really useful tool for helping you debug graphics issues with your work. It can help you look deeper into how your application is working on the graphics card level and give you more information about how your application is managing it’s resources. It’s saved me a few times when I’ve caught my application loading images twice as often as it should, or finding some obscure shader errors when XCode wasn’t being helpful.
It used to be included with XCode, but now you’ll need to go to the Apple Developer area and download the “XCode Graphics tools” as a separate download, it includes a lot of other useful tools that I hope to cover in some future tutorials (OpenGL Driver Monitor is great for watching VRAM usage to diagnose low frame rates, Quartz Composer is also part of those tools).
The OpenGL Profiler can be used with any of the creative coding toolsets that use OpenGL, so MaxMSP/Jitter, Quartz Composer, Processing, OpenFrameworks, Cinder, etc etc are all fair game here. You can even run this on an application like VDMX to see all the currently loaded shaders if you want to have a peek at another app. I’m not going to go into to much depth about how to use the Profiler to actually debug because there are a lot of options to play with and they get very specific, I’m just going to post a sort of “Getting Started” since the actual helper file can be a bit dense.
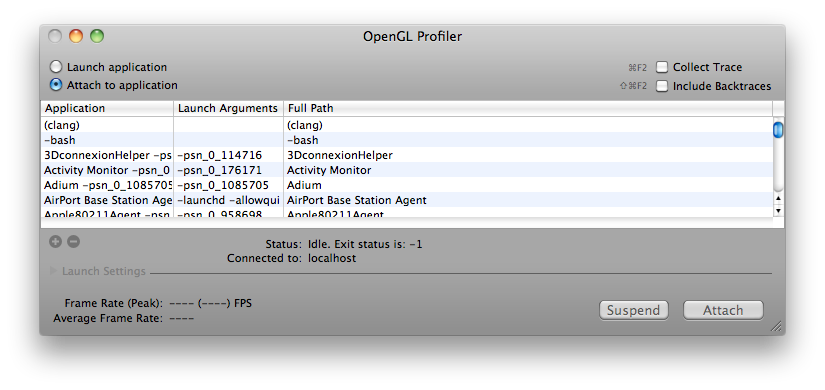
So once you’ve downloaded the Profiler from Apple’s Developer Connection, open it up and you’ll see this:
(Click for Larger)
Next you should run the application you’re looking to dive into. Once it is running, it should appear somewhere in the list of currently running apps. Go ahead and select it and hit “Attach” – and now you have several options to explore. I’m using the openFrameworks “multishaderTextureExample” in this tutorial. Let’s take a look at looking at an application’s loaded Resources first.
GL Resources:
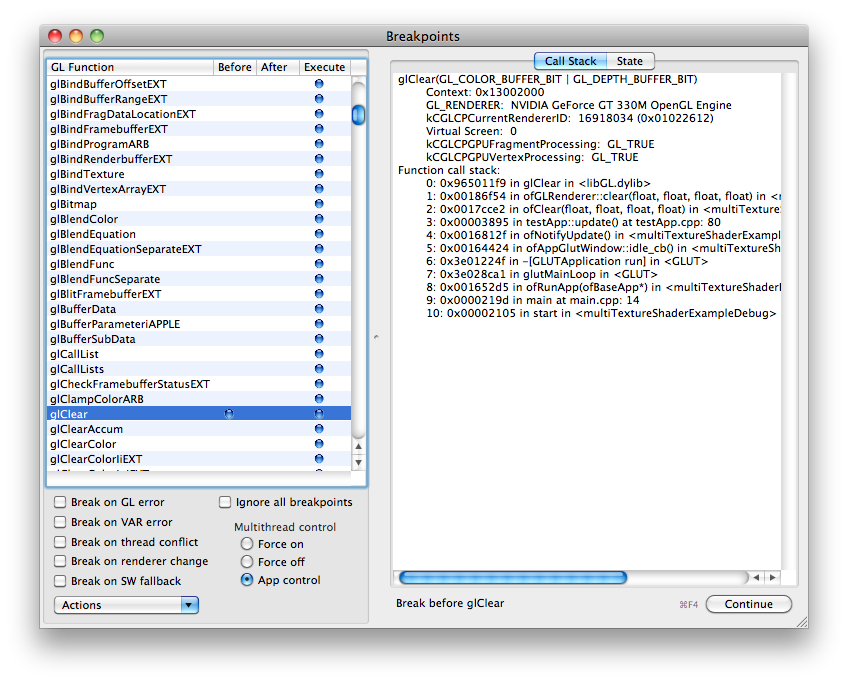
In order to look at the application’s Resources, the application has to be stalled on a breakpoint, so let’s set that up. In the Profiler Menus at the top, pick “Views” and then “Breakpoints” and you’ll be greeted with a long list of different GL calls.
Obviously if you’re looking to play with a specific GL call you can find the specific one you’re interested in, but I generally just go for a common call that I know HAS to be running in my app somewhere, even if I didn’t explicitly call it. My fallback is glClear because the screen usually has to get cleared sometime…
Find glClear in the list of glFunctions, and when you’re ready, click in that row next to either “Before” or “After” and a blue dot will appear and your application will pause. To reverse this, remove the blue dot by clicking, and click “Continue”
Also, while you’re here…have a look on the right side of the Breakpoints window and select the State tab, and this will let you look at all the currently enabled or disabled GL states like depth testing, GL Point Size, GL Line Width etc etc.
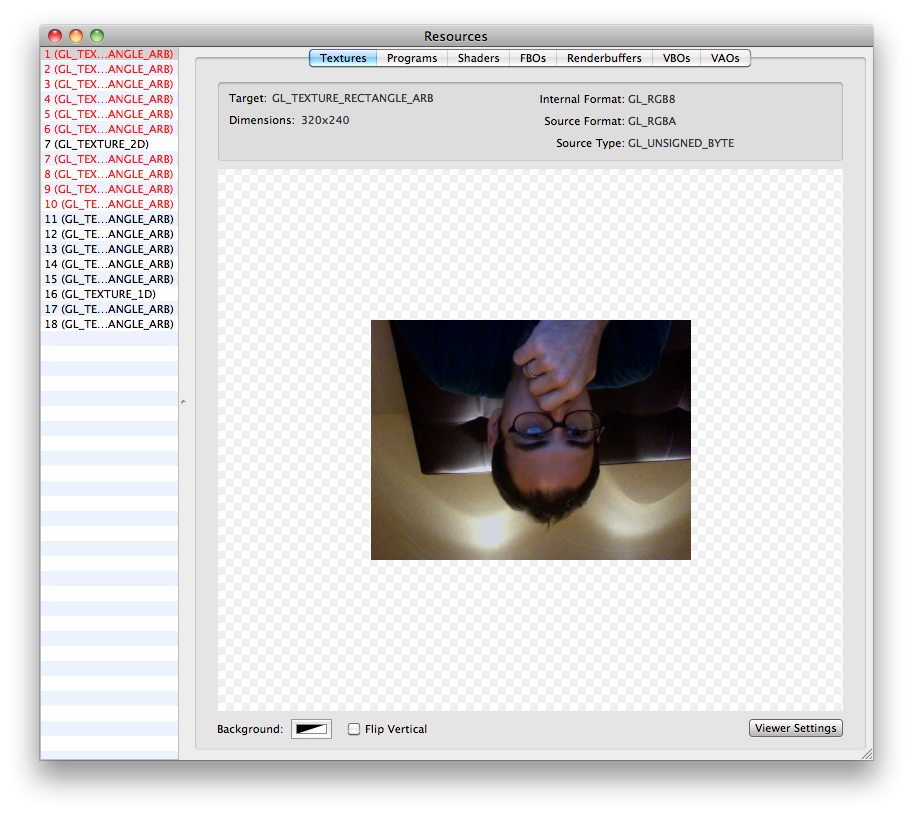
Now you can pry it open and look at what exactly was going on at the moment of pausing. Go back to the “Views” menu at the top and select “Resources”
Now you can see a huge list of options for the graphics resources that have been loaded for your application.
The “Textures” tab in Resources will show you almost all of the currently loaded textures in your application, useful if you’re working with a lot of loaded static images. Everything will appear upside down, but that is just how it is loaded in GL.
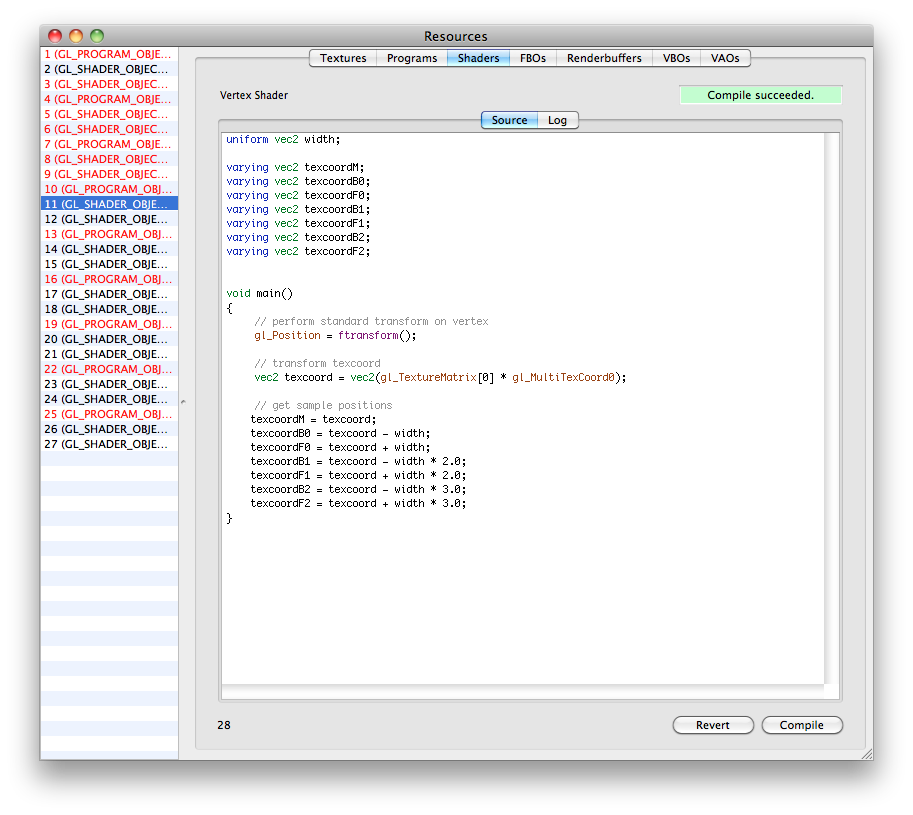
The “Shaders” tab will actually let you look at the GLSL code of your loaded fragment and vertex shaders. This is useful if you need to track down compile errors or any other weird things about how the shaders might be loaded. The log will show some warnings about the issues with your shader variables and things of that nature. You can also change the code and recompile shaders on the fly while your app is running if necessary. To do live shader editing from GL Profiler, (1) find the shader you’re working on in the list, (2) change the code (3) hit “Compile” (4) back in the “Breakpoints” window – Disable the breakpoint, and (5) click “Continue” to start the app again with your updated shader code. It should now run with whatever changes you made if it compiled successfully.
You can also look at the info for your FBO’s, VBO’s and other topics if necessary.
Statistics:
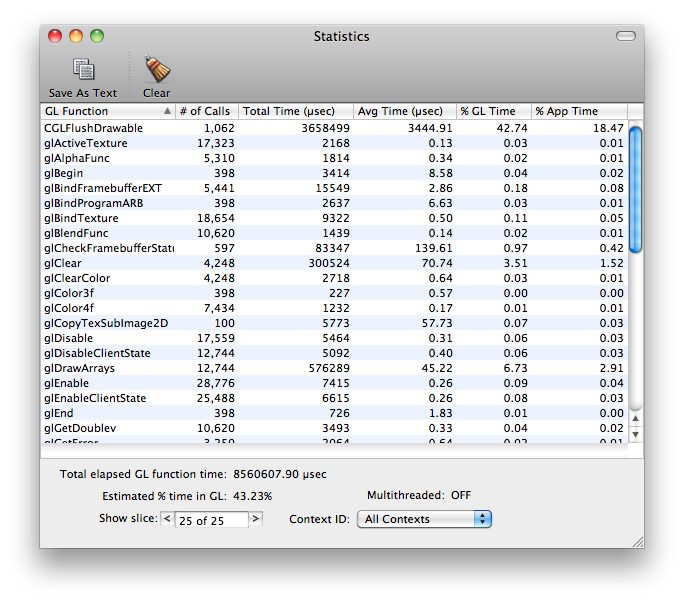
You can also have a look at your application’s GL statistics to see what calls are taking up the most time within the application. This is useful if you just added something that is suddenly bogging down your app, and then you can see that you’re now calling glVertex3f a few hundred thousand more times than you were a second ago..whoops. This can also give you an idea of what calls are taking the longest to actually execute…like glGetTexImage for example.
To look at statistics, you don’t need to do the Breakpoints method, just select Statistics from the menu while your application is attached and running.
Trace:
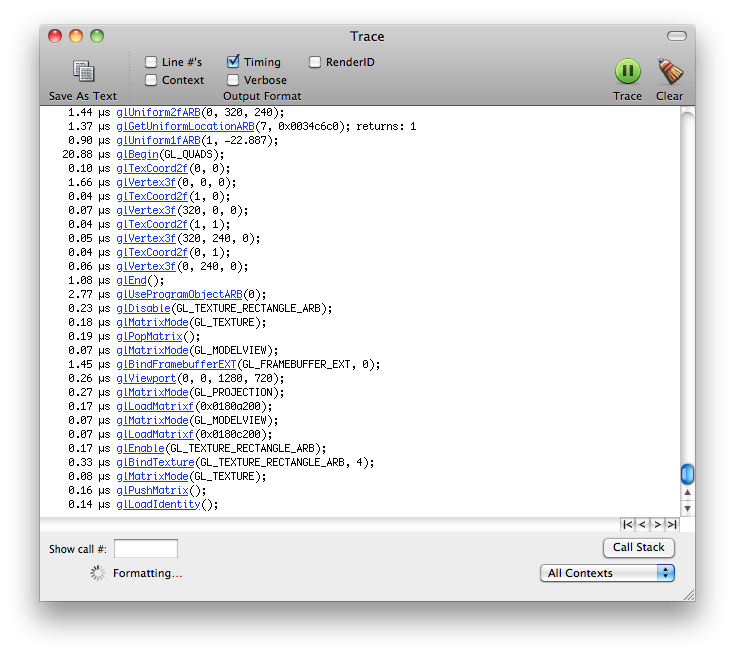
This is essentially a different view of the Statistics page, but it lays out the different GL calls in chronological order. You can use this to have a really fine detail view of what is going on in terms of when your GL calls are being executed and in which order (eg Why is glClear being called there? Oh THAT’s why it’s drawing black right now).
—————
I hope that gives you a good introduction to the OpenGl Profiler tool for working with your own applications, please share any more informative or helpful tips in the comments below…thanks!
