Author: laser

  • Commercial Work – Page 1

    This post is a sample of the large scale and commercial work I have done as the lead creative technologist at Fake Love in NYC


    Lexus – Trace Your Road – Life Sized Video Game – Rome, Italy – 2013

    My role: I was one of the lead technical developers and designers for this piece, along with Dan Moore and Ekene Ijeoma. Programmed in openFrameworks on OSX and iOS.

    Lexus | TRACE YOUR ROAD | Director’s Cut from Fake Love on Vimeo.

    ——————————–

    AmEx Instagram Towers – Fashion Week – Lincoln Center, NYC –  2012

    My role: Lead technical architect on the hardware and interaction, also programmed by Caitlin Morris Made with openFrameworks.

    Amex Fashion Week Instagram Towers from Fake Love on Vimeo.

    ———————————

    NY Pops Gala 2012 – Interactive Conductors Baton – Carnegie Hall, NYC – 2012

    My role: I was the programmer and tech lead on this project. Devised the tracking system, custom baton, software and design. Made with openFrameworks and Max/MSP/Jitter

    NY Pops | Gala 2012 from Fake Love on Vimeo.

    ———————————-

    Google Project Re:Brief Coke – Interactive Vending Machine – Worldwide – 2011

    My role: I was the lead tech for the installation/physical side of this project (another company did the banners and web server portion). I did the vending machine hacking, setup and programming in New York, Cape Town, Mountain View and Buenos Aires. This project went on to win the first Cannes Lions mobile award. Other programming and hardware hacking by Caitlin Morris, Chris Piuggi, and Brett Burton. Made with openFrameworks.

    Project Re:Brief | Coke from Fake Love on Vimeo.

    —————————-

    Shen Wei Dance Arts – Undivided Divided – Park Avenue Armory, NYC – 2011

    My role: Lead projection designer, programmer, and live show visualist. I designed the entire 12 projector system for this Shen Wei premiere at the Park Avenue Armory. I also programmed and maintained the playback system for the 5 night run of the show. Made with Max/MSP/Jitter and VDMX

    Shen Wei | Park Avenue Armory from Fake Love on Vimeo.

    ——————————-

    Shen Wei Dance Arts – Limited States – Premiere – 2011

    My role: Lead projection designer, programmer and live show visualist. I designed the playback and technology system for this new piece by choreographer Shen Wei. I also contributed heavily to some of the visual effect programming seen in some of the pre-rendered clips. Made with Max/MSP and VDMX.

    Shen Wei – Limited States from Fake Love on Vimeo.

    ——————————–

    Sonos – Playground and Playground Deconstructed – SXSW and MOMI NYC – 2013

    My role: I was the technical designer of the hardware and projections for this audio reactive immersive piece. Red Paper Heart was the lead designer and developer on this project which they made with Cinder.

    PLAYGROUND DECONSTRUCTED from Fake Love on Vimeo.

  • Using OpenFrameworks OpenCV Blob Detection with Syphon and VDMX

    A slightly different version of this post will eventually get posted to the fantastic VDMX blog, but here I will focus a little more about getting things up and running in OpenFrameworks. This will assume you have a little bit of experience with OpenFrameworks and XCode, but let me know if you need more info in the comments. This will work for any Syphon enabled application, but I’m going to stick with VDMX for simplicity. This will walk you through the important connections you will need to make to get VDMX and an OpenFrameworks application talking via Syphon for the purposes of performing computer vision/OpenCV operations on your live visuals.

    Currently most commercial visual performance softwares do not include methods of actually analyzing the imagery of what you’re playing with, they tend to focus on working on sound analysis. Image analysis can potentially be much slower than audio analysis, but the algorithms are getting fast enough now that it becomes a viable option for incorporating into live setups. Image analysis can be a useful tool for performance because you can either use the info in the images to process itself (e.g. If it’s really bright, do X. If there is a face in the video, do Y). You can also use it for interesting graphical effects that are harder to achieve with traditional shaders and filters (e.g. Put a pulsing red rectangle around parts of the image that are moving).

    On Github, I have sample code and VDMX project for you that helps to walk through the individual components of:

    1. Send VDMX layer output via Syphon
    2. Capture the VDMX Syphon feed in OpenFrameworks as a Texture (actually an IO Surface under the hood..not quite a texture)
    3. Transform the Texture into Pixels that that can be processed by OpenCV
    4. Process those Pixels with OpenCV (In this case we are doing Contour finding/Blob detection)
    5. Draw Contours/Bounding Boxes in OpenFrameworks
    6. Capture desired drawn output in OpenFrameworks as a Texture (here, drawn contour lines)
    7. Output that Texture via Syphon
    8. Pick the OF Texture up in VDMX and overlay with original feed
    9. Control communication between both VDMX and OF with OSC (Use VDMX audio analysis to drive OF CV parameters)

    Here is a demo of this whole setup running in a feedback loop from VDMX->Syphon->OF->OpenCV->Syphon->VDMX:


    This setup will run at roughly 60fps on a 2010 Macbook Pro. Granted the resolution is fairly low sending between the two apps, but if you are just doing analysis for low rez details, sometimes 320×240 may be all you need. No need to process 1280 x 720 to get contours if you don’t need the accuracy. There are also occasional frame drops between OF and VDMX because I’m not doing frame syncing between the apps, so occasionally it tries to process a frame that isn’t there. I also have a version of this setup for running Kyle McDonald/Arturo Castro’s Face Substitution code with VDMX input and output. The setup for that one is a little more complicated but I will eventually post a tutorial for that as well.

  • Applescript to automatically fullscreen Madmapper for installations

    This is a simple Applescript that I used with a long running installation that required Madmapper for doing some precise mapping. More info on keeping long running installations going is here: http://blairneal.com/blog/installation-up-4evr/

    This script would be used on reboot to both open your Syphon enabled app and to open your madmapper file, open it, select fullscreen, and then hit OK on the dialog box.

    It requires you to set your own file path in the script for your madmapper file and application file.

    To use the code below:

    1. Open Applescript and paste it into a new file

    2. Change the filepaths and resolution so they match how it appears in your setup (ie resolution may be 3840×720 instead)

    2. Go to “File -> Export” and select “Application” as your file format

    3. In System Preferences -> Users & Groups -> Login items drop your applescript application in there to automatically launch on boot


    You can also add in pauses (for things to load) and other checks with applescript if necessary.

    This script will fail if for some reason the resolution has changed on boot or something – if the text doesn’t match exactly how it is in the Output menu of madmapper, it won’t work.

    NOTE: I personally do not recommend using Madmapper for long running installations – there are occasional issues with it losing keyboard focus and it can appear as if your machine has locked you out if accessing it remotely. It’s also typically best practice to try and keep everything simplified into one application so you can minimize weird occurrences. In the case that we had to use this, there was not enough development time to add in the mapping code that was necessary.


    tell application "Finder" to open POSIX file "YourInstallationApp.app" --add your absolute file path to your application
    
    delay 10 --wait 5 seconds while your app loads up
    
    tell application "Finder" to open POSIX file "/Users/you/yourmadmapperfile.map" --absolute filepath to your madmapper file
    
    do_menu("MadMapper", "Output", "Fullscreen On Mainscreen: 1920x1200") --change this line to your determined resolution
    
    on do_menu(app_name, menu_name, menu_item)
    	try
    		-- bring the target application to the front
    		tell application app_name
    			activate
    		end tell
    		delay 3 --wait for it to open
    		tell application "System Events"
    			tell process app_name
    				tell menu bar 1
    					tell menu bar item menu_name
    						tell menu menu_name
    							click menu item menu_item
    							delay 3 --wait for Is fullscreen OK? box to appear
    							tell application "System Events" to keystroke return
    						end tell
    					end tell
    				end tell
    			end tell
    		end tell
    
    		return true
    	on error error_message
    		return false
    	end try
    end do_menu
  • Using the OpenGL Profiler with OpenFrameworks (Or Cinder, Processing, etc etc.)

    Using the OpenGL Profiler with OpenFrameworks (Or Cinder, Processing, etc etc.)

    The OS X OpenGL Profiler is a really useful tool for helping you debug graphics issues with your work. It can help you look deeper into how your application is working on the graphics card level and give you more information about how your application is managing it’s resources. It’s saved me a few times when I’ve caught my application loading images twice as often as it should, or finding some obscure shader errors when XCode wasn’t being helpful.

    It used to be included with XCode, but now you’ll need to go to the Apple Developer area and download the “XCode Graphics tools” as a separate download, it includes a lot of other useful tools that I hope to cover in some future tutorials (OpenGL Driver Monitor is great for watching VRAM usage to diagnose low frame rates, Quartz Composer is also part of those tools).

    The OpenGL Profiler can be used with any of the creative coding toolsets that use OpenGL, so MaxMSP/Jitter, Quartz Composer, Processing, OpenFrameworks, Cinder, etc etc are all fair game here. You can even run this on an application like VDMX to see all the currently loaded shaders if you want to have a peek at another app. I’m not going to go into to much depth about how to use the Profiler to actually debug because there are a lot of options to play with and they get very specific, I’m just going to post a sort of “Getting Started” since the actual helper file can be a bit dense.

    So once you’ve downloaded the Profiler from Apple’s Developer Connection, open it up and you’ll see this:

    (Click for Larger)

    Screen shot 2013-08-03 at 9.23.02 PM

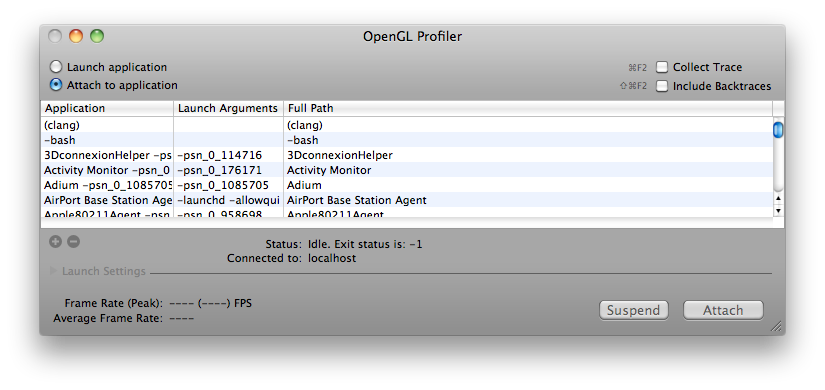
    Next you should run the application you’re looking to dive into. Once it is running, it should appear somewhere in the list of currently running apps. Go ahead and select it and hit “Attach” – and now you have several options to explore. I’m using the openFrameworks “multishaderTextureExample” in this tutorial. Let’s take a look at looking at an application’s loaded Resources first.

    GL Resources:

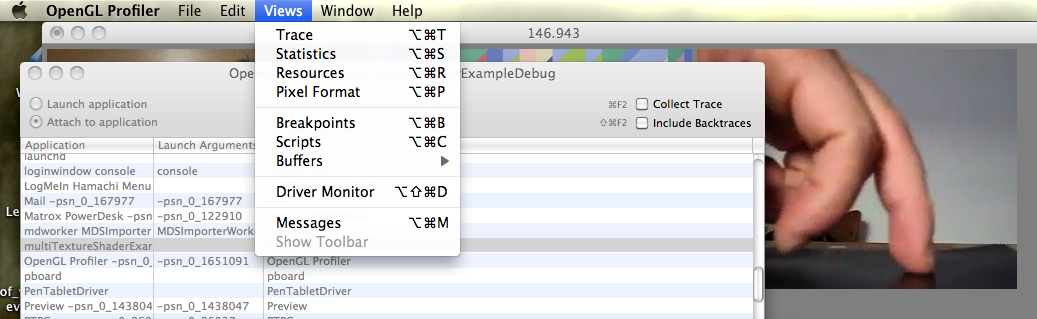
    In order to look at the application’s Resources, the application has to be stalled on a breakpoint, so let’s set that up. In the Profiler Menus at the top, pick “Views” and then “Breakpoints” and you’ll be greeted with a long list of different GL calls.

    Screen shot 2013-08-03 at 9.25.11 PM

    Obviously if you’re looking to play with a specific GL call you can find the specific one you’re interested in, but I generally just go for a common call that I know HAS to be running in my app somewhere, even if I didn’t explicitly call it. My fallback is glClear because the screen usually has to get cleared sometime…

    Find glClear in the list of glFunctions, and when you’re ready, click in that row next to either “Before” or “After” and a blue dot will appear and your application will pause. To reverse this, remove the blue dot by clicking, and click “Continue”

    Screen shot 2013-08-03 at 9.25.47 PM

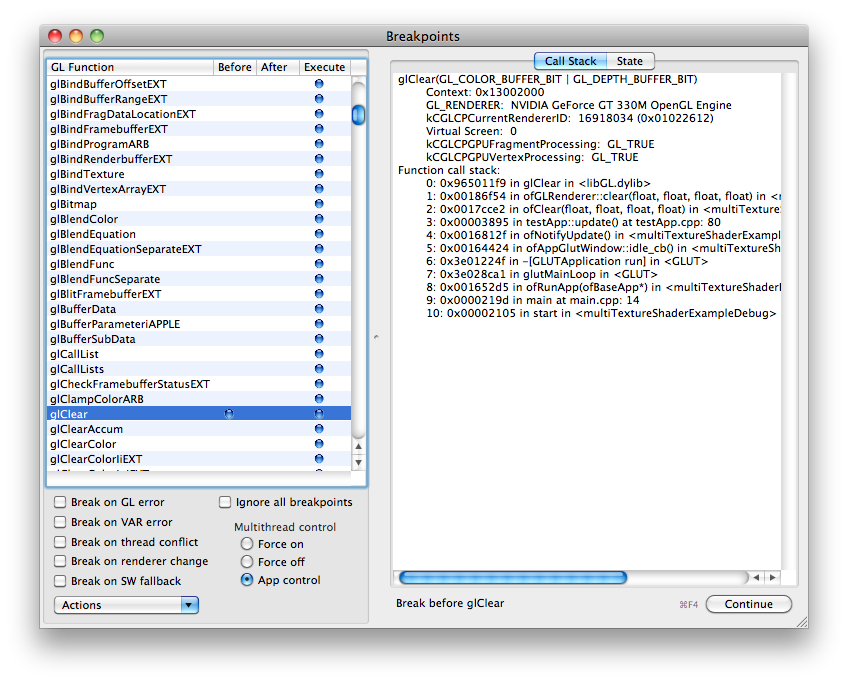
    Also, while you’re here…have a look on the right side of the Breakpoints window and select the State tab, and this will let you look at all the currently enabled or disabled GL states like depth testing, GL Point Size, GL Line Width etc etc.

    Now you can pry it open and look at what exactly was going on at the moment of pausing. Go back to the “Views” menu at the top and select “Resources”

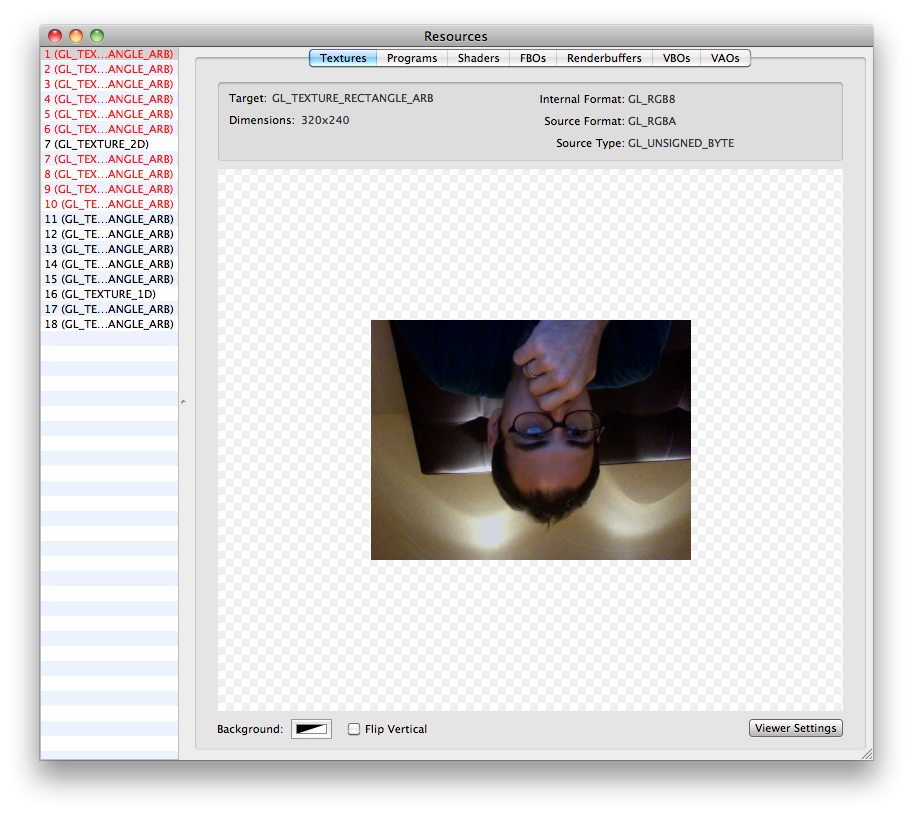
    Now you can see a huge list of options for the graphics resources that have been loaded for your application.


    The “Textures” tab in Resources will show you almost all of the currently loaded textures in your application, useful if you’re working with a lot of loaded static images. Everything will appear upside down, but that is just how it is loaded in GL.

    Screen shot 2013-08-03 at 9.39.51 PM

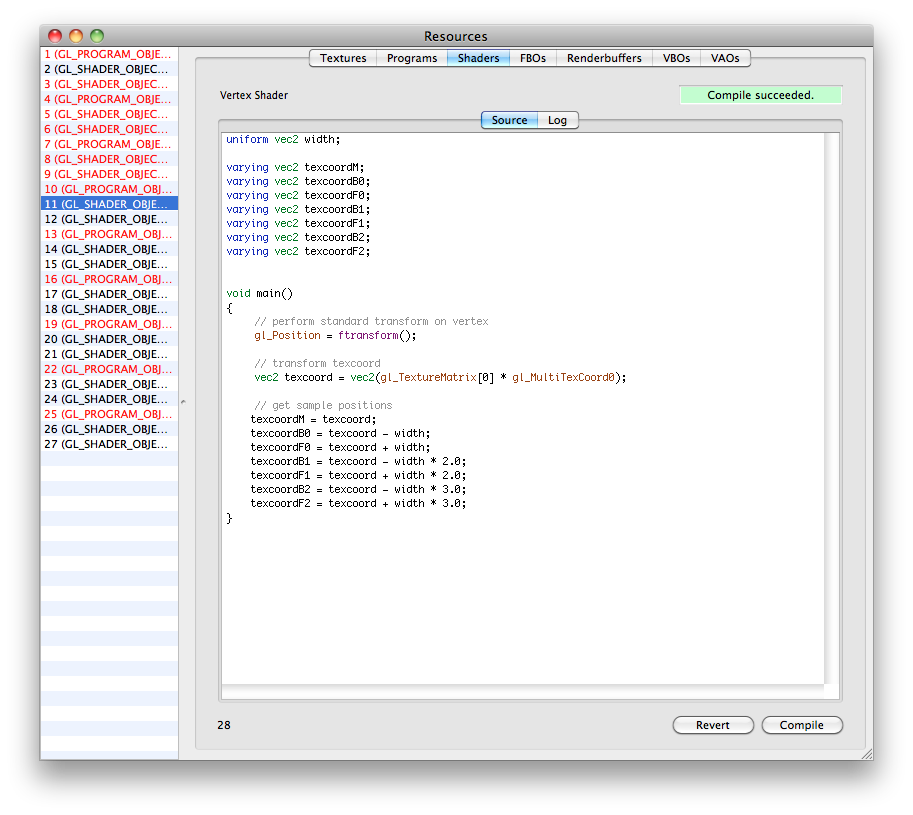
    The “Shaders” tab will actually let you look at the GLSL code of your loaded fragment and vertex shaders. This is useful if you need to track down compile errors or any other weird things about how the shaders might be loaded. The log will show some warnings about the issues with your shader variables and things of that nature. You can also change the code and recompile shaders on the fly while your app is running if necessary. To do live shader editing from GL Profiler, (1) find the shader you’re working on in the list, (2) change the code (3) hit “Compile” (4) back in the “Breakpoints” window – Disable the breakpoint, and (5) click “Continue” to start the app again with your updated shader code. It should now run with whatever changes you made if it compiled successfully.

    Screen shot 2013-08-03 at 10.22.45 PM

    You can also look at the info for your FBO’s, VBO’s and other topics if necessary.
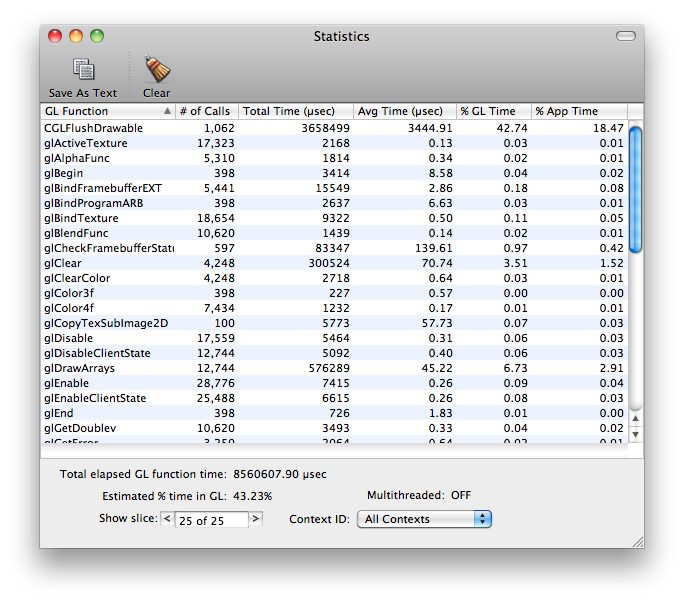
    Statistics:

    You can also have a look at your application’s GL statistics to see what calls are taking up the most time within the application. This is useful if you just added something that is suddenly bogging down your app, and then you can see that you’re now calling glVertex3f a few hundred thousand more times than you were a second ago..whoops. This can also give you an idea of what calls are taking the longest to actually execute…like glGetTexImage for example.

    To look at statistics, you don’t need to do the Breakpoints method, just select Statistics from the menu while your application is attached and running.
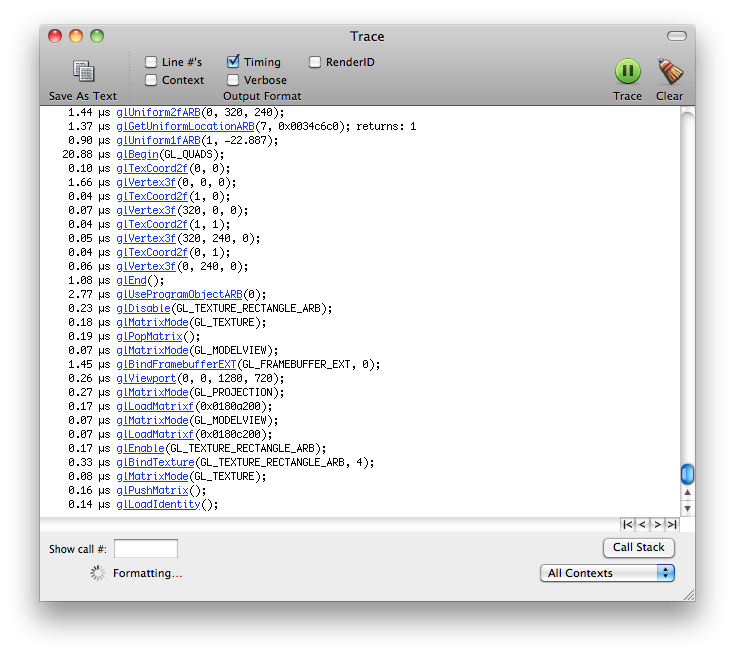
    Screen shot 2013-08-03 at 9.43.46 PM

    Trace:

    This is essentially a different view of the Statistics page, but it lays out the different GL calls in chronological order. You can use this to have a really fine detail view of what is going on in terms of when your GL calls are being executed and in which order (eg Why is glClear being called there? Oh THAT’s why it’s drawing black right now).

    Screen shot 2013-08-03 at 10.10.05 PM

    —————

    I hope that gives you a good introduction to the OpenGl Profiler tool for working with your own applications, please share any more informative or helpful tips in the comments below…thanks!


  • The Biggest Optical Feedback Loop in the World (Revisited)

    Optical feedback is a classic visual effect that results when an image capture device (a camera) is pointed at a screen that is displaying the camera’s output. This can create an image that looks like cellular automata/reaction-diffusion or fractals and can also serve as a method of image degradation through recursion.

    Many video artists have used this technique to create swirling patterns as a basis for abstract videos, installations and music videos. Feedback can also be created digitally by various means including continually reading and drawing textures in a frame buffer object (FBO) but the concept is essentially the same. In this post I’m writing up a thought experiment for a project that would create the biggest optical feedback loop in the world.

    Sample of analog video feedback:

    Optical Feedback Loop from Adam Lucas on Vimeo.

    Sample of video feedback (digital rendering from software):

    I really enjoy the various forms of this effect from immediate feedback loops to “slower” processes like image degradation. Years ago, I did a few projects involving video feedback and image degradation via transmission, and this thought experiment combines those two interests. Lately, I’ve also been obsessed with really unnecessarily excessive, Rube Goldberg-like uses of technology, and this fits that interest pretty well. It’s like playing a giant game of Telephone with video signals.

    While in residency at the Experimental Television Center in 2010, I was surrounded by cameras, monitors and 64 channel video routers. After a few sessions with playing with feedback on the Wobbulator, I drew up a sketch for making a large video feedback loop using all of the possible equipment in the lab…and a Skype feed for good measure. Here is that original sketch:

    sketch_mod


    The eventual output of a large feedback loop ended up not looking the best because the setup was a little hacky and ended up losing detail very quickly due to camera auto adjustments and screens being too bright. The actual time delay through the whole system including Skype was still just a few frames. There was also several decades between equipment and a break between color and black & white feeds at certain points. I’ve returned to the idea a few times and I’ve wanted to push it a little further.

    As a refresher, this is the most basic form of optical feedback, just a camera plugged into a screen that it is capturing.

    Feedback-1-stage

    You can also add in additional processors into the chain that can effect the image quality (delays, blurs, color shifts, etc). Each of these effects will be amplified as they pass through the loop.

    Processed_feedback


    The above are the most common and straightforward techniques of optical feedback. They will generate most of the same feedback effects as the larger systems I’m proposing, generally with a shorter delay and less degradation. Doesn’t hurt to ask about what will happen if we add another stage to the feedback system:

    Dual-stage-feedback

    We’ll lose a little more image quality now that the original photons have been passed through twice as many pieces of glass and electronics. Let’s keep passing those photons around through more stages. You could put a blinking LED in front of one of the screens and have it send it’s photons through all the subsequent screens as they transform digitally, and electrically. The LED’s light would arrive behind it in some warped, barely perceivable fashion but it would really just be a sort of ghost of the original photons.

    6-stage-feedback

    We can take the above example of a 6 stage video feedback loop and start working out what we might need to hit as many image and screen technologies as we can think of from the past 50 years. Video art’s Large Hadron Collider.

    Click for detail

    6-stage-feedback_example

    By hitting so many kinds of video processing methods we would get a video output that would be just a little delayed, and would create some interesting effects at certain points in the chain. By varying camera resolutions, camera capture methods, and analog versus digital technologies, we can bounce the same basic signal through all of these different sensor and cable types. The signal would become digital and analog at many different stages depending on the final technologies chosen. The digital form of the signal would have to squeeze and stretch to become analog again. The analog signal would need to be sampled, chopped and encoded into its digital form. Each of these stages would have their own conversions happening between:

    • Video standards/Compressions (NTSC, PAL, H.264, DV, etc.)
    • Resolutions/Drawing methods (1080p, 480p, 525 TV Lines)
    • Voltages
    • Refresh Rates
    • Scan methods (CMOS, CCD, Vidicon Tube)
    • Illumination methods (LED, Fluorescent Backlight, CRT)
    • Wire types
    • Pixel types
    • Physical Transforms. (Passing through glass lenses, screens) etc etc

    By adding in broadcast and streaming technologies like Skype, we can extend the feedback loop not only locally within one area, but also globally. One section of the chain can be sent across the globe to another studio running a similar setup with multiple technologies. This can continue being sent around to more and more stations as long as the end is always sent back to the first monitor in the chain.

    A digital feedback or video processing step could also be added where several chains of digital feedback occur as well.

    If you were able to create a system large enough, there could be so much processing happening for the signal itself to become delayed for a few seconds before it reaches the “original” start location. In this large system, you could wave your hand in between a monitor and camera, and get a warped “response” back from yourself a second or two later.

    It’s interesting for me to consider what the signal would be at this point, after going through so many conversions and transforms. Is the signal a discrete moment as it passes from monitor to screen, or does it somehow keep some inherent properties as it fires around the ring?

    Suggested Links:

    http://softology.com.au/videofeedback/videofeedback.htm

  • Sonic Prints

    Sonic Prints


    THIS PAGE IS OUTDATED!! Check the new post here and download the software to try for yourself!


    Using openFrameworks and ofxFFT to generate 3D Meshes of sound data for use in 3D printing.

    This is very much a work in progress, but just wanted to share some initial results while I work on the final visual output. I have done some initial prints (see below) but have found that I’d like to make some much larger prints to be able to really get the detail out of the generated models. This project is interesting for me because it allows me to look at the structure of a song in a different way than a musical score or just a volume intensity graph like we’re used to.  I can also play with the idea of making physical objects out of songs in a different way than burning a CD, pressing a vinyl or etching a wax cylinder.

    We will be releasing the source after I get rid of a few bugs and clean a few things up, just need time to make those adjustments. Then you’ll be able to tweak it and make your own 3D meshes for your own real-time music and sound input.

    The meshes are set up like this: left is generally the bass/low end, right is high end. Red or orange marks are the loudest frequency band at that particular time. White to black shows the relative volume intensity of the particular time. I can adjust the number of frequency bands it is looking at and make it more coarse or fine.

    If you would like one of the 3D mesh files to look at for yourself, I can send you a sample. The individual files are about 20mb so I don’t want to host them here yet.

    You can see some images of sample prints below, they are about the size of a bangle or bracelet.

    Sample prints now available on Thingiverse

    I have been doing this as a personal project and a side project where I work: www.fakelove.tv

    3DFFT Sonic Prints – Work in Progress from blair neal on Vimeo.

    Screen shot 2013-05-17 at 1.57.57 PM Screen shot 2013-05-18 at 7.14.48 PM annuals-3d-Print debugviewart kanye west - power Screen shot 2013-05-24 at 12.27.51 PM Son lux - all the right things 3d_print_test 3dFFT_print


    3DFFT _Sonic prints example – Son Lux – “Easy” from blair neal on Vimeo.

  • Memory Leak Murderer

    A theoretically useful, but dangerous shell script for use on OS X…proceed with caution.

    Now of course you always do a solid job on your programming, but maybe you didn’t have enough time to find all the memory leak bugs that start to appear a few days into your installation. Something that only appears up after your software loops through 100 times is a much harder thing to deal with than something that shows up every single time. Sometimes you need a hot fix if you’re not able to find the true cause on short notice.

    The following is a script that you’ll need to modify for your own uses, but this is essentially what it does: When set to run automatically (cron job or lingon), it checks your computer’s processes every so often to check their memory usage. If an application suddenly shoots over the memory usage threshold, this script quits the leaky app, and then re-opens it…hopefully freeing up leaked memory and allowing the computer to run for a longer period.

    Sometimes apps that have leaked too much can grind your computer to a halt and even your other automatic scripts can have a hard time running, so this can work as an early warning system. This could even be modified to email you if your app goes over a specified memory amount.

    Thanks to Patricio Gonzalez Vivo for the help with the regular expressions and logic/formatting syntax in the shell scripting

    Again, test ahead of time if possible:

    #!/bin/sh
    #Script to reboot application after crossing memory usage threshold
    #Can be used in conjunction with Lingon or a Cron to run on a periodic basis, e.g. every 2 minutes.
    #Version 1.0 written by Daniel Mare from http://hintsforums.macworld.com/showthread.php?p=592991
    #Date: 02/08/2010
    #Modified by Blair Neal 11_27_2012 http://www.blairneal.com
    #Helpful shell scripting additions from Patricio Gonzalez Vivo http://www.patriciogonzalezvivo.com/
    
    MEM_THRESHOLD=6 #INTEGERS ONLY If any process uses more MEM (in percentage of total MEM) than this threshold, the application will be rebooted
    #Say you have 8gb of RAM, then a process that is using 2gb or more would be using 25%
    
    #test is MEM usage is excessive
    MEM_LINE=$(ps wwaxm -o %mem,command | head -2 | tail -1) #Output from ps showing the TOP app that is using the most memory
    MEM_USAGE=`echo $MEM_LINE | sed 's/ .*//'` #Strip off the numbers from above output
    MEM_USAGE=${MEM_USAGE/.*} #Truncate decimals - bash only compares integers TODO: incorporate this line into one above
    
    if [ $MEM_USAGE -gt $MEM_THRESHOLD ] ; then
        #echo "Original line: " $MEM_LINE | sed -e 's/.*///' 
        MEM_PROCESS=`echo $MEM_LINE | sed -e 's/.*///'` #this is the process name, used to kill the app later
        MEM_FORMATTED=`echo $MEM_LINE | sed -e 's/.*///' | sed 's/ -psn_[0-9]_[0-9]*/.app/' | sed 's/ //g'` #Get the name of process that triggered this alert, strip off the -psn and ID numbers and delete all spaces so it can be compared with your app name. Could be more elegant, but gets the job done!
        echo "Memory leak threshold exceeded by this process: " $MEM_FORMATTED
        echo $MEM_FORMATTED "It was using this percentage of memory: " $MEM_USAGE
    
        if [ $MEM_FORMATTED == "Twitter.app" ]; then #make sure you're killing your own app, not something else important like a system process
            echo "Closing Leaky App " $MEM_PROCESS
            killall $MEM_PROCESS
        else
            echo "This is not the leaky process you're looking for!" #Your app wasn't the culprit
        fi
    else
        echo "All is well! Your app is not using too much memory."
    fi
    
    sleep 15 #Wait 15seconds (arbitrary) for everything to close out before restarting
    
    #Now check and see if your app is closed out, and if it isn't then re-open it
    if [ $(ps ax | grep -v grep | grep "Twitter.app" | wc -l) -eq 0 ] ; #Replace Twitter.app with your own app's name
        then
        echo "YourAppName not running. Opening..."
        open /Applications/Twitter.app
    else
        echo "YourAppName running"
    fi

    You could also set it to open an Automator Script or an Applescript to do whatever it is you need run instead of having it just close and open your app.

    P.S. I’ve found Firefox is a really good tester if you need something that gobbles up memory quickly 🙂

  • Doggifer

    Doggifer

    DoggiferIcon

    Doggifer is an application that saves or tweets animated gifs of your pet’s movement’s throughout the day. It can also just be a general use toy for collecting automatically triggered animated gifs. You will need to set up a twitter account to use the twitter portion of the app. Instructions for setting that up are included in the readme file accompanying the app.

    Download Here: Doggifer v4 (2589 downloads )   (Only tested on OSX 10.6.8 but will run all day on a 5yr old laptop)

    You can see my dog Margot when we set up the cam at home @doggifer on twitter.

    Doggifer is made with openFrameworks and uses ofxUI from Reza Ali and ofxGifEncoder from Jesus Gollonet and Nick Hardeman.

    You can grab the source of Doggifer on my github and change stuff up as much as you’d like. Originally made with OF0073. Let me know if you have suggestions and I’ll do my best to add them. Let me know if you catch any good shots!

    If you do use Doggifer, I’m not personally asking for any compensation, but I (and many animals!) would really appreciate it if you donated to a local animal shelter instead. There is a very deserving no-kill shelter ( Sean Casey Animal Rescue ) in NYC that I’m a fan of and they would certainly appreciate your donations!

    DoggiferScreenshot
    734152129 717991804 683912867 669534709


    Creative Commons License
    Doggifer by Blair Neal is licensed under a Creative Commons Attribution-NonCommercial-ShareAlike 3.0 Unported License.

  • Guide to Camera Types for Interactive Installations

    I just published an epic article over on Creative Applications detailing the use of different kinds of cameras in interactive installations. Check it out, and add any additional tips in the comments there!:

    http://www.creativeapplications.net/tutorials/guide-to-camera-types-for-interactive-installations/

  • The Ethereal Geometric Volume in music videos

    The Ethereal Geometric Volume in music videos

    I wanted to write something about a very specific genre of music videos that seems to pop up every few years and has only continued to increase in popularity as special effects costs get lower and the techniques get more accessible. This music video type can be found in genres ranging from electronica to rock and beyond. The trope common to all the music videos I’m discussing is the use of the ethereal geometric volume 

    phantocube

    An ethereal geometric volume is a plot device similar to something like Hitchcock’s MacGuffin where it can simply exist as a polygonal device to move the plot along without it really being explained what this volume really is.

    These devices can be the main characters, a representation of an omnipotent force, a terror, an alien invasion. They can be Cubes, Pyramids, and Spheres or broken polygonal shapes. They can be shattered to bits and oh..good lord, they float and hover like nobody’s business.

    Let’s start at n=4..the PYRAMID

    m83 pink triangle

    Pyramid Example #1: M83 – “Wait” – 2012

    Pyramid as Spaceship

    M83 ‘Wait’ Official video from The Creators Project on Vimeo.

    dark triangle ship flying triangle planetflying triangle

    Pyramid Example #2: Frank Ocean – “Pyramids” – 2012

    Pyramid as Structure and 2d John Mayer guitar solo background

    frank ocean [pyramids] from christopher francis ocean on Vimeo.

    frank ocean triangle frankocean_eyeballfrank ocean real pyramid


    Now let’s step forward into n=6…the CUBE

    Cube example #1: Phantogram – Don’t Move – 2012

    Cube as ethereal looming terror (with shatter!)

    Phantogram ‘Don’t Move’ from 10lb Pictures on Vimeo.

    phano cube hug phanto cube overlayphanto cube loomingphanto cube shatter2 phanto cube shatter phanto hand cube phanto hold cube

    Cube example #2: Battles – Atlas – 2007

    Cube as floating spaceship stage (low-rez…anyone have an HD link for this vid?)

    battles battles3

    Cube example #3: Mew – Introducing Palace Players – 2009

    Cubes as alien lifeforms

     mew snails cubemew1mew cube3 mew cube2 mew cube

    Cube Example #4: M83 – We Own the Sky – 2009

    Cubes as alien life forms (with shatter!)

    m83_sky1 m83_sky_4 m83_sky_2 m83_sky_6 m83_sky_shatter

    Cube Example #5: Kid606 – Sometimes – 2006

    Cubes as alien life forms (also with shatter…)


    And then finally n= infinity…the SPHERE

    Sphere example #1: The Antlers – Bear – 2010

    Sphere as relationship burden/unborn child

    antlers1 antlershatter3 antlersshatter AntlersCart4 AntlersCart5

    (Hemi)Sphere Example #2: Denali – Hold your breath – 2003

    Sphere as strange alien invasion of a river jam session

    Denali1 Denali5