November 2nd, 2014
We’re Live – Live TV Face Substitution
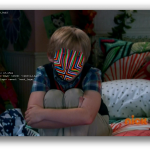
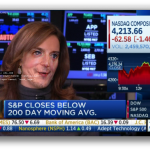
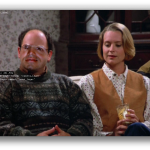
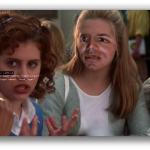
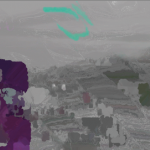
We’re Live is a project involving live HD cable TV and face substitution software. It is a hardware and software method for doing a real time facial composite/replacement on live television. The original face substitution implementation and cloning shader was created by Kyle McDonald and Arturo Castro in 2012 (link to Github source). The face tracking algorithm that enables this kind of high quality facial substitution was developed by Jason Saragih.
One of television’s greatest powers is in its ability to display very structured and edited views of reality. By watching the fabricated streams of the shows, viewers begin to wish for the interesting, exciting and impossible lives of the characters. They can subconsciously desire the smiles and trouble free lives enabled by buying the products in the advertisements. With this software, viewers can come one step closer to truly seeing themselves on screen.
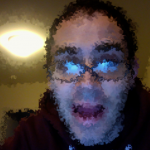
We’re Live allows a user to composite their face (or any face they choose) onto a live television stream. Essentially, anyone you watch on TV can finally look like you….or anyone you want. You could make everyone on TV look like Bill Murray if you really wanted to.
Download of the software is available in the Technical details section


We’re Live – Live TV Face Substitution from blair neal on Vimeo.
————
Technical details/process:
The first part of the process involves actually getting the live TV into your computer so you can process it for face substitution. I have been using the following:
Blackmagic Mini Recorder
Orei 1×2 HDMI Splitter – strips HDCP
Alternate to the Orei Splitter
The HDMI Splitter is the silver bullet for actually capturing live TV off a digital set top box. Most set top boxes and game consoles have what is called HDCP or High Definition Copy Protection which blocks you from…well…copying or recording the HD signal which is something we could potentially do with this setup. The Blackmagic Mini Recorder does not comply with HDCP, so your set top box signal will not even show up when you try to just plug it in straight. Certain HDMI splitters, (like the one listed) will comply with the HDCP handshake on their input, but ignore it for their output – these splitters effectively strip HDCP so you can do whatever you like with the signal.
Once you have Set top box HDMI-> HDMI Splitter -> Black Magic Mini Recorder -> Thunderbolt -> Mac Computer – you can start doing some face substitution!
–DOWNLOAD–
Here is a ZIP of the software with an included VDMX project file for working with it (OSX Only):
Syphon_Face_Sub_v1.0.zip (210 downloads)
Usage:
VDMX is my software of choice for actually getting the captured signal from Blackmagic into the face substitution software. I have included a VDMX Project file with the software to show you how to do this all yourself. With my setup, I am able to get 1280×720 at 60hz (or 720p@59.94 according to the actual capture settings I’m using)
Once I have the TV signal in VDMX, I actually pass the video texture to the face substitution software using Syphon. Once it is in there, it is constantly searching for new faces to map the mask layer onto. You don’t have to use a live TV signal – you can put a movie file into VDMX onto the “camera layer” source and use that layer to apply your masks to.
On another layer in VDMX, you can pass in the “mask” you want to apply to the footage. For example – this would be your face that you pass in via webcam. To save processing time and not run 2 face trackers constantly – I actually have this capture your face on a key press – when your face is in camera – you press the ‘m’ key in the face sub software to set the new mask. You can put still images or movies or a live webcam into the “masks” layer in VDMX. Alternatively – you can put a bunch of files into the “faces” folder in the “data” folder and use the arrow keys to cycle to different faces.
You can press ‘d’ to bring up the GUI for different settings like viewing which mask is currently loaded and things like that.
Recording/Displaying output:
You can capture the output of the openFrameworks program in Syphon as well, and use that to go fullscreen in VDMX or something if you hide those layers. I use the Syphon Recorder to record my demos.
Note about Audio:
Currently nothing in this setup fully supports audio. You can capture audio with the Black Magic recorder and use that as your audio source in Syphon Recorder — but a caveat:
The audio is “ahead” of the video due to input and processing steps – meaning you will hear something 6 frames (0.2s) before you see it (for example – your results may vary). To fix this – you could make an audio delay buffer in something like Max/MSP. If you are recording output with audio – you will need to re-sync it later in your editing software – I recommend a clap board or hand clap at the beginning of recordings – something recognizable for sync in video and audio.
Alternate version/Upgrade: There is an alternate version of the software that isn’t fully integrated yet into this executable/binary (but the source is available on github under the OriginalCycling branch) – which will allow you to map arbitrary textures to the live tracked face. This released current version only allows you to put a face on a face. The other version lets you put more abstract non-face things and map them onto the same area. It works by storing the mesh points of a pre-tracked face, and using those to apply an arbitrary image to the face mesh that is properly texture mapped. This alternate versions also features a way to crossfade between different faces.
June 6th, 2014
New Code – ofxCoreImage, ofxQuneo
Been working on some of my first openFrameworks addons – figured it made sense to post them here in case anyone has trouble finding them on my github:
Ever since transitioning from using Quartz Composer to openFrameworks, I wanted the ability to use the easy OSX Core Image filters inside OF apps. After finding an example online, I built out an addon that does just that. You can use about 70 of the 130+ built in filters – I just need to provide class breakouts for the other filters.
It’s still in development for now and needs some issues fixed with getting input and output properly and working with the GL Contexts so that I can properly use a GLFW window.

This addon does a breakout of the QuNeo MIDI controller so that you can send its values out over OSC and easily access them in your program if you need a quick physical interface without decoding all the control values.
There is also a breakout for the Akai MPD24 that does the exact same thing, but wasn’t sure if there would be much demand for that as a separate addon.
This is a simple addon for when you’re trying to debug something with your display or projector. Does checkerboards, single pixel grids, animated gradients, etc etc. More coming soon hopefully.
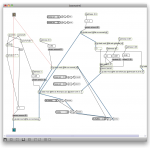
I have been revisiting my old visual performance Max/Jitter patch and I decided to make it publicly accessible. The only thing I can’t post are some shaders that have questionable licensing agreements attached to them, but if you remove those modules it should work just fine.
November 27th, 2013
How to keep an installation up forever – Part 2
This is a new post following my previous article: How to keep an installation up 4evr
In this addendum, I’m going to outline some new tricks you might find useful for keeping long running installations going – or at least so you can keep an eye on them. I’m keeping an eye on 3 separate, complex installations at work right now so I needed some new tools to make sure everything is running smoothly. Please let me know if you have any new tricks to add in comments below!
Most of the tricks try to avoid third party software and just use the base OS X/Unix tools available as they would (hopefully) be the least error prone methods and sure to work with the system you’re on.
1. Process Logger
If you have an installation that runs for weeks or months, you might want a way to keep tabs on it that doesn’t involve remotely logging in and checking on it. A good thing to have would be to have something on the system that writes certain info to a text file (kept on a linked Dropbox), or better write that file to a web server that you can then check.
There are a couple things you can do depending on what you want to know about the state of your installation.
There is a terminal command you can use to get a list of all of the currently running processes on your computer:
ps aux (or ps ax)
(more info above ps commands here) – Further more you can filter this list to only return applications you’re interested in learning about:
ps aux | grep "TweetDeck"
This will return a line like this:
USER             PID  %CPU %MEM      VSZ    RSS   TT  STAT STARTED      TIME COMMAND
laser          71564   0.4  1.7  4010724 140544   ??  S    Sun03PM  14:23.76 /Applications/TweetDeck.app/Contents/MacOS/TweetDeck -psn_0_100544477
laser          95882   0.0  0.0  2432768    600 s000  S+   12:11PM   0:00.00 grep TweetDeck
Now you have the following useful info: CPU usage, Memory usage (as percentage of total memory), Status, Time Started, Time Up
All that is left is to write this output to a text file, which you can do with a line like this:
ps aux | grep 'TweetDeck' >> /Users/laser/Dropbox/InstallationLogs/BigImportantInstall/Number6ProcessLog.txt
Now we just need to make this an executable shell script and set it up as a launch daemon or cron job – see the previous article at Step 3 to learn how to run the shell script at a regular interval using Lingon and launchd. If the app isn’t running, it will only return the “grep YourAppName” process which is a good thing to log because if your app isn’t open you won’t know how long it’s been out (nothing will be logged), but having the grep process logged will at least tell you it was checking for it. Grep will also more accurately tell you what time it checked – the other app will only give you a start time and up time.
Let’s also take this one step further and say, hypothetically, that the Triplehead2Go display adapter you have is fairly wonky and you don’t always get the displays or projectors to connect after reboot – or maybe a projector is shutting itself off and disrupting things. Well we can log the currently available resolutions too! Try entering the line below in your own terminal:
system_profiler SPDisplaysDataType
This will return a list of connected displays and some metadata about them including resolution and names.
Let’s say you want to make sure you’re running a resolution of 3840×720 at all times…or you want a log of resolution changes. You would do something like:
system_profiler SPDisplaysDataType | grep Resolution
This will return “Resolution: 3840×720” which you can combine with the above lines to write it all to a text file. So here would be your shell script file if you wanted to record the currently running processes and the current resolutions:
#!/bin/bash
ps aux | grep 'YourAppName' >> /Users/you/filepath/Install6ProcessLog.txt
system_profiler SPDisplaysDataType | grep Resolution >> /Users/you/Dropbox/Install6ProcessLog.txt
And now you’re feeling excited, maybe you want to grab a fullscreen screenshot at a regular interval too, just to make sure there is no funkiness happening that you can’t see…well you could add this line to the above as well:
screencapture ~/Desktop/$(date +%Y%m%d-%H%M%S).png
This will save a screenshot to the desktop (specify your own file path) with a formatted date and time. You may want to do this every hour instead of every 5 minutes since it’s a big chunk of data and it may cause some issue with your screens. As usual – test before deploying!
Bonus points would be to create an auto-generated table and webpage that takes all of this info and puts it into a nice view that you can use to check all of your installations at a glance.
2. Email Yourself on crash or other behavior
If the process logger isn’t enough, we can use what we learned in that process to actually set up a system to email you if something is amiss so you don’t have to manually check it. We can do this all with the command line and internal tools, it’s just a more involved setup. This is going to be fairly general and will need some tuning in your specific case.
First you will need to configure postfix so you can easily send emails from the terminal – follow the instructions here as closely as possible: http://benjaminrojas.net/configuring-postfix-to-send-mail-from-mac-os-x-mountain-lion/
If you were using a gmail account you would do:
InstallationSupport@gmail.com
pass: yourpassword
The line in the passwd file mentioned in the article would be: smtp.gmail.com:587 installationSupport@gmail.com:yourpassword
Now send a test email to yourself by running: echo “Hello” | mail -s “test” “InstallationSupport@gmail.com”
Second step is to combine this new found ability to send emails from the Terminal with a process to check if your application is still running…something like the below would work with some tweaking for what you’re looking to do:
#!/bin/sh
if [ $(ps ax | grep -v grep | grep "YourApp.app" | wc -l) -eq 0 ] ; #Replace YourApp.app with your own app's name
then
    	SUBJECT="Shit broke"
    	EMAIL="InstallationSupport" #this is the receiver
   	 EMAILMESSAGE="This could be for adding an attachment/logfile"
   	 echo "The program isn't open - trying to re-open">$SUBJECT
   	 date | mail -s "$SUBJECT" "$EMAIL"  "$EMAILMESSAGE"

    	echo "YourApp not running. Opening..."

    open /Applications/YourApp.app #reopen the app - set this to an exact filepath
else
    echo "YourApp is running"
fi
Now you just need to follow the instructions from Step 3 in the other article to set this shell script up to run with launchd – you can check it every 5 minutes and have it email you if it crashed. You could also adapt the If statement to email you if the resolution isn’t right or some other process condition.
3. Memory leak murderer
See this article about combining the above process with something that kills and restarts an app if it crosses a memory usage threshold
Bonus – if using MadMapper – see this link for an AppleScript that will open MadMapper and have it enter fullscreen – and enter “OK” on a pesky dialog box.
November 24th, 2013
Commercial Work – Page 1
This post is a sample of the large scale and commercial work I have done as the lead creative technologist at Fake Love in NYC
Lexus – Trace Your Road – Life Sized Video Game – Rome, Italy – 2013
My role: I was one of the lead technical developers and designers for this piece, along with Dan Moore and Ekene Ijeoma. Programmed in openFrameworks on OSX and iOS.
Lexus | TRACE YOUR ROAD | Director’s Cut from Fake Love on Vimeo.
——————————–
AmEx Instagram Towers – Fashion Week – Lincoln Center, NYC – 2012
My role: Lead technical architect on the hardware and interaction, also programmed by Caitlin Morris Made with openFrameworks.
Amex Fashion Week Instagram Towers from Fake Love on Vimeo.
———————————
NY Pops Gala 2012 – Interactive Conductors Baton – Carnegie Hall, NYC – 2012
My role: I was the programmer and tech lead on this project. Devised the tracking system, custom baton, software and design. Made with openFrameworks and Max/MSP/Jitter
NY Pops | Gala 2012 from Fake Love on Vimeo.
———————————-
Google Project Re:Brief Coke – Interactive Vending Machine – Worldwide – 2011
My role: I was the lead tech for the installation/physical side of this project (another company did the banners and web server portion). I did the vending machine hacking, setup and programming in New York, Cape Town, Mountain View and Buenos Aires. This project went on to win the first Cannes Lions mobile award. Other programming and hardware hacking by Caitlin Morris, Chris Piuggi, and Brett Burton. Made with openFrameworks.
Project Re:Brief | Coke from Fake Love on Vimeo.
—————————-
Shen Wei Dance Arts – Undivided Divided – Park Avenue Armory, NYC – 2011
My role: Lead projection designer, programmer, and live show visualist. I designed the entire 12 projector system for this Shen Wei premiere at the Park Avenue Armory. I also programmed and maintained the playback system for the 5 night run of the show. Made with Max/MSP/Jitter and VDMX
Shen Wei | Park Avenue Armory from Fake Love on Vimeo.
——————————-
Shen Wei Dance Arts – Limited States – Premiere – 2011
My role: Lead projection designer, programmer and live show visualist. I designed the playback and technology system for this new piece by choreographer Shen Wei. I also contributed heavily to some of the visual effect programming seen in some of the pre-rendered clips. Made with Max/MSP and VDMX.
Shen Wei – Limited States from Fake Love on Vimeo.
——————————–
Sonos – Playground and Playground Deconstructed – SXSW and MOMI NYC – 2013
My role: I was the technical designer of the hardware and projections for this audio reactive immersive piece. Red Paper Heart was the lead designer and developer on this project which they made with Cinder.
PLAYGROUND DECONSTRUCTED from Fake Love on Vimeo.
November 24th, 2013
Using OpenFrameworks OpenCV Blob Detection with Syphon and VDMX
A slightly different version of this post will eventually get posted to the fantastic VDMX blog, but here I will focus a little more about getting things up and running in OpenFrameworks. This will assume you have a little bit of experience with OpenFrameworks and XCode, but let me know if you need more info in the comments. This will work for any Syphon enabled application, but I’m going to stick with VDMX for simplicity. This will walk you through the important connections you will need to make to get VDMX and an OpenFrameworks application talking via Syphon for the purposes of performing computer vision/OpenCV operations on your live visuals.
Currently most commercial visual performance softwares do not include methods of actually analyzing the imagery of what you’re playing with, they tend to focus on working on sound analysis. Image analysis can potentially be much slower than audio analysis, but the algorithms are getting fast enough now that it becomes a viable option for incorporating into live setups. Image analysis can be a useful tool for performance because you can either use the info in the images to process itself (e.g. If it’s really bright, do X. If there is a face in the video, do Y). You can also use it for interesting graphical effects that are harder to achieve with traditional shaders and filters (e.g. Put a pulsing red rectangle around parts of the image that are moving).
On Github, I have sample code and VDMX project for you that helps to walk through the individual components of:
- Send VDMX layer output via Syphon
- Capture the VDMX Syphon feed in OpenFrameworks as a Texture (actually an IO Surface under the hood..not quite a texture)
- Transform the Texture into Pixels that that can be processed by OpenCV
- Process those Pixels with OpenCV (In this case we are doing Contour finding/Blob detection)
- Draw Contours/Bounding Boxes in OpenFrameworks
- Capture desired drawn output in OpenFrameworks as a Texture (here, drawn contour lines)
- Output that Texture via Syphon
- Pick the OF Texture up in VDMX and overlay with original feed
- Control communication between both VDMX and OF with OSC (Use VDMX audio analysis to drive OF CV parameters)
Here is a demo of this whole setup running in a feedback loop from VDMX->Syphon->OF->OpenCV->Syphon->VDMX:
This setup will run at roughly 60fps on a 2010 Macbook Pro. Granted the resolution is fairly low sending between the two apps, but if you are just doing analysis for low rez details, sometimes 320×240 may be all you need. No need to process 1280 x 720 to get contours if you don’t need the accuracy. There are also occasional frame drops between OF and VDMX because I’m not doing frame syncing between the apps, so occasionally it tries to process a frame that isn’t there. I also have a version of this setup for running Kyle McDonald/Arturo Castro’s Face Substitution code with VDMX input and output. The setup for that one is a little more complicated but I will eventually post a tutorial for that as well.
September 19th, 2013
Applescript to automatically fullscreen Madmapper for installations
This is a simple Applescript that I used with a long running installation that required Madmapper for doing some precise mapping. More info on keeping long running installations going is here: http://blairneal.com/blog/installation-up-4evr/
This script would be used on reboot to both open your Syphon enabled app and to open your madmapper file, open it, select fullscreen, and then hit OK on the dialog box.
It requires you to set your own file path in the script for your madmapper file and application file.
To use the code below:
1. Open Applescript and paste it into a new file
2. Change the filepaths and resolution so they match how it appears in your setup (ie resolution may be 3840×720 instead)
2. Go to “File -> Export” and select “Application” as your file format
3. In System Preferences -> Users & Groups -> Login items drop your applescript application in there to automatically launch on boot
You can also add in pauses (for things to load) and other checks with applescript if necessary.
This script will fail if for some reason the resolution has changed on boot or something – if the text doesn’t match exactly how it is in the Output menu of madmapper, it won’t work.
NOTE: I personally do not recommend using Madmapper for long running installations – there are occasional issues with it losing keyboard focus and it can appear as if your machine has locked you out if accessing it remotely. It’s also typically best practice to try and keep everything simplified into one application so you can minimize weird occurrences. In the case that we had to use this, there was not enough development time to add in the mapping code that was necessary.
tell application "Finder" to open POSIX file "YourInstallationApp.app" --add your absolute file path to your application

delay 10 --wait 5 seconds while your app loads up

tell application "Finder" to open POSIX file "/Users/you/yourmadmapperfile.map" --absolute filepath to your madmapper file

do_menu("MadMapper", "Output", "Fullscreen On Mainscreen: 1920x1200") --change this line to your determined resolution

on do_menu(app_name, menu_name, menu_item)
	try
		-- bring the target application to the front
		tell application app_name
			activate
		end tell
		delay 3 --wait for it to open
		tell application "System Events"
			tell process app_name
				tell menu bar 1
					tell menu bar item menu_name
						tell menu menu_name
							click menu item menu_item
							delay 3 --wait for Is fullscreen OK? box to appear
							tell application "System Events" to keystroke return
						end tell
					end tell
				end tell
			end tell
		end tell

		return true
	on error error_message
		return false
	end try
end do_menu
August 3rd, 2013
Using the OpenGL Profiler with OpenFrameworks (Or Cinder, Processing, etc etc.)
The OS X OpenGL Profiler is a really useful tool for helping you debug graphics issues with your work. It can help you look deeper into how your application is working on the graphics card level and give you more information about how your application is managing it’s resources. It’s saved me a few times when I’ve caught my application loading images twice as often as it should, or finding some obscure shader errors when XCode wasn’t being helpful.
It used to be included with XCode, but now you’ll need to go to the Apple Developer area and download the “XCode Graphics tools” as a separate download, it includes a lot of other useful tools that I hope to cover in some future tutorials (OpenGL Driver Monitor is great for watching VRAM usage to diagnose low frame rates, Quartz Composer is also part of those tools).
The OpenGL Profiler can be used with any of the creative coding toolsets that use OpenGL, so MaxMSP/Jitter, Quartz Composer, Processing, OpenFrameworks, Cinder, etc etc are all fair game here. You can even run this on an application like VDMX to see all the currently loaded shaders if you want to have a peek at another app. I’m not going to go into to much depth about how to use the Profiler to actually debug because there are a lot of options to play with and they get very specific, I’m just going to post a sort of “Getting Started” since the actual helper file can be a bit dense.
So once you’ve downloaded the Profiler from Apple’s Developer Connection, open it up and you’ll see this:
(Click for Larger)
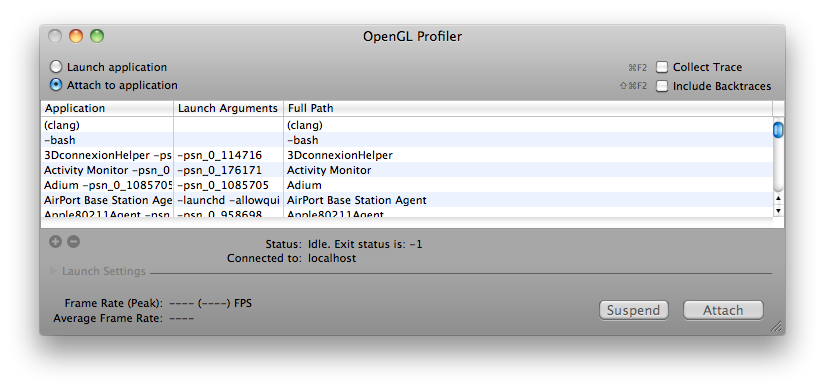
Next you should run the application you’re looking to dive into. Once it is running, it should appear somewhere in the list of currently running apps. Go ahead and select it and hit “Attach” – and now you have several options to explore. I’m using the openFrameworks “multishaderTextureExample” in this tutorial. Let’s take a look at looking at an application’s loaded Resources first.
GL Resources:
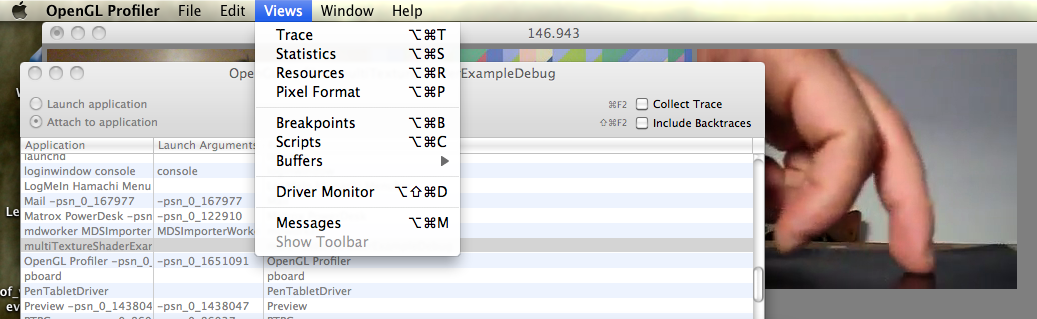
In order to look at the application’s Resources, the application has to be stalled on a breakpoint, so let’s set that up. In the Profiler Menus at the top, pick “Views” and then “Breakpoints” and you’ll be greeted with a long list of different GL calls.
Obviously if you’re looking to play with a specific GL call you can find the specific one you’re interested in, but I generally just go for a common call that I know HAS to be running in my app somewhere, even if I didn’t explicitly call it. My fallback is glClear because the screen usually has to get cleared sometime…
Find glClear in the list of glFunctions, and when you’re ready, click in that row next to either “Before” or “After” and a blue dot will appear and your application will pause. To reverse this, remove the blue dot by clicking, and click “Continue”
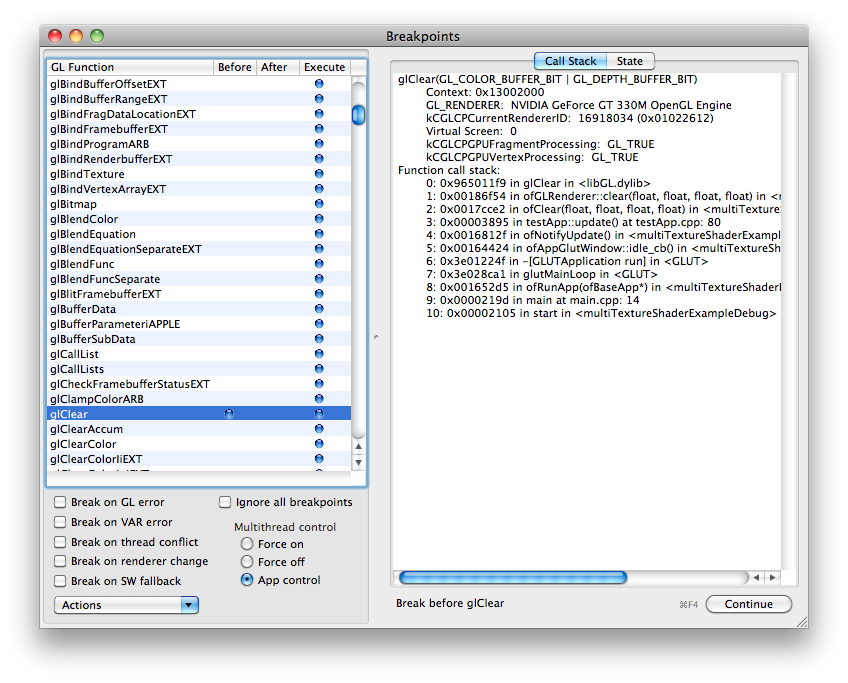
Also, while you’re here…have a look on the right side of the Breakpoints window and select the State tab, and this will let you look at all the currently enabled or disabled GL states like depth testing, GL Point Size, GL Line Width etc etc.
Now you can pry it open and look at what exactly was going on at the moment of pausing. Go back to the “Views” menu at the top and select “Resources”
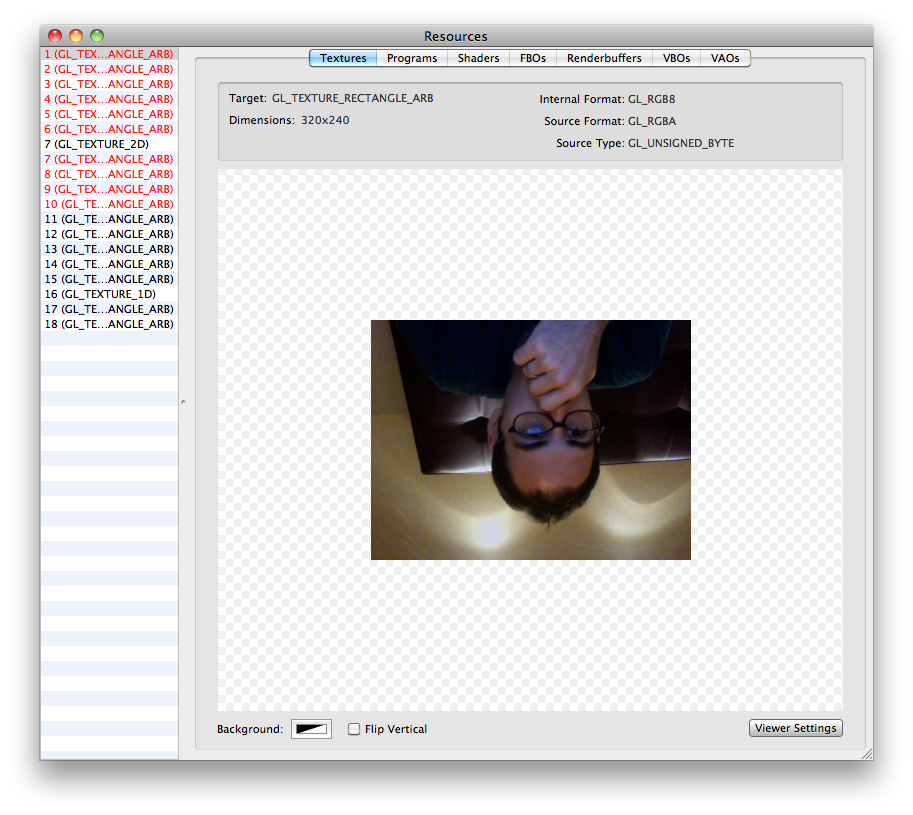
Now you can see a huge list of options for the graphics resources that have been loaded for your application.
The “Textures” tab in Resources will show you almost all of the currently loaded textures in your application, useful if you’re working with a lot of loaded static images. Everything will appear upside down, but that is just how it is loaded in GL.
The “Shaders” tab will actually let you look at the GLSL code of your loaded fragment and vertex shaders. This is useful if you need to track down compile errors or any other weird things about how the shaders might be loaded. The log will show some warnings about the issues with your shader variables and things of that nature. You can also change the code and recompile shaders on the fly while your app is running if necessary. To do live shader editing from GL Profiler, (1) find the shader you’re working on in the list, (2) change the code (3) hit “Compile” (4) back in the “Breakpoints” window – Disable the breakpoint, and (5) click “Continue” to start the app again with your updated shader code. It should now run with whatever changes you made if it compiled successfully.
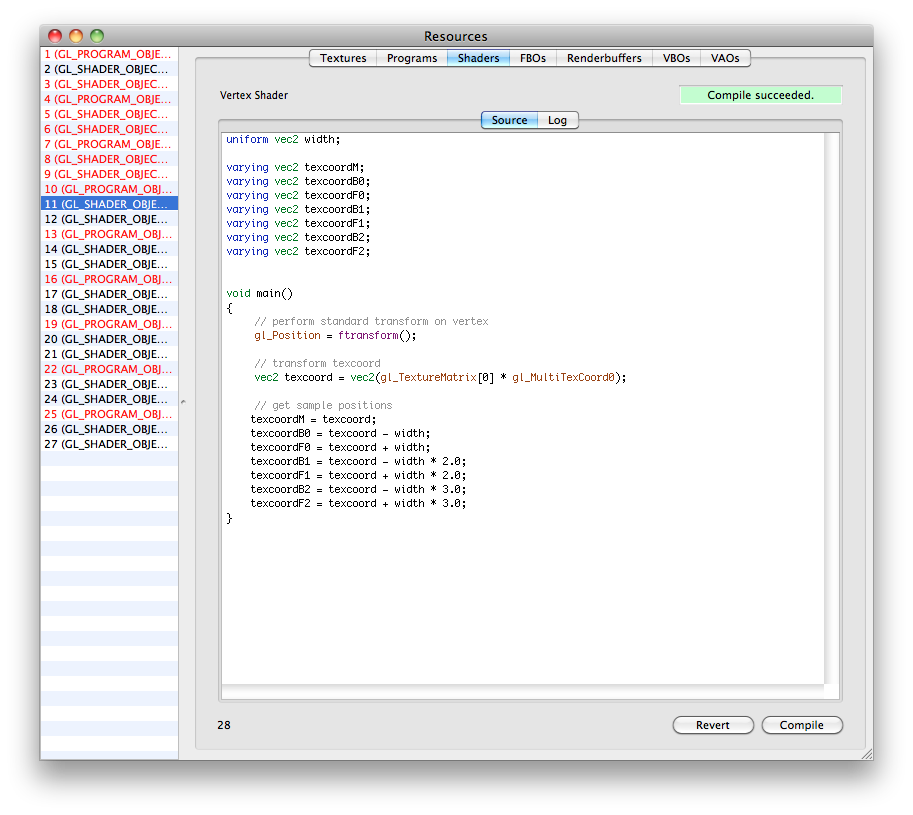
You can also look at the info for your FBO’s, VBO’s and other topics if necessary.
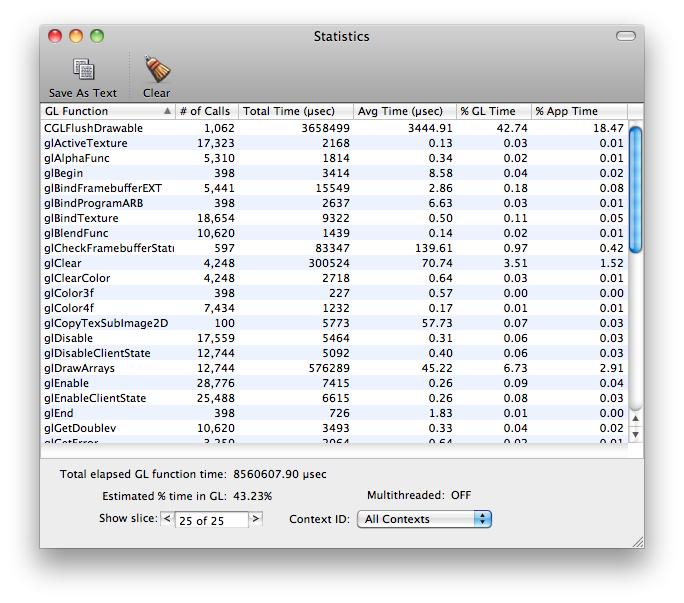
Statistics:
You can also have a look at your application’s GL statistics to see what calls are taking up the most time within the application. This is useful if you just added something that is suddenly bogging down your app, and then you can see that you’re now calling glVertex3f a few hundred thousand more times than you were a second ago..whoops. This can also give you an idea of what calls are taking the longest to actually execute…like glGetTexImage for example.
To look at statistics, you don’t need to do the Breakpoints method, just select Statistics from the menu while your application is attached and running.
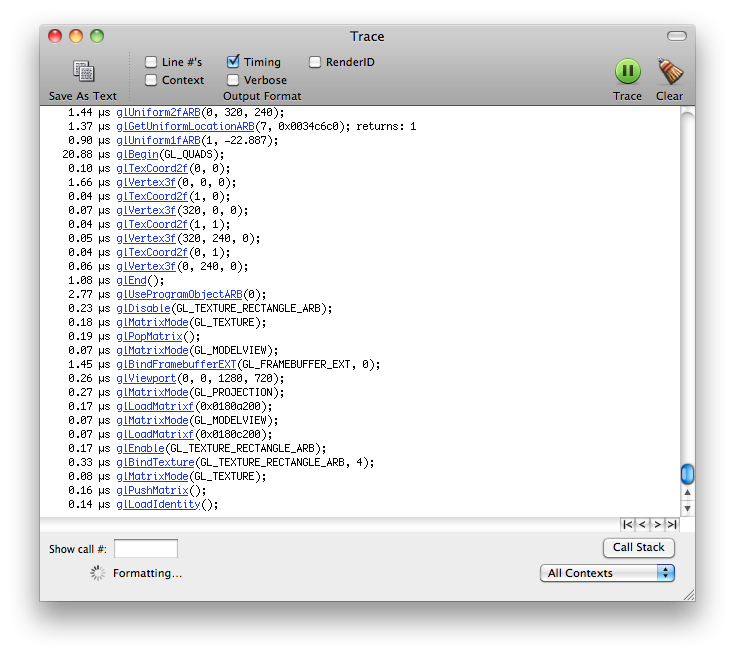
Trace:
This is essentially a different view of the Statistics page, but it lays out the different GL calls in chronological order. You can use this to have a really fine detail view of what is going on in terms of when your GL calls are being executed and in which order (eg Why is glClear being called there? Oh THAT’s why it’s drawing black right now).
—————
I hope that gives you a good introduction to the OpenGl Profiler tool for working with your own applications, please share any more informative or helpful tips in the comments below…thanks!
July 7th, 2013
The Biggest Optical Feedback Loop in the World (Revisited)
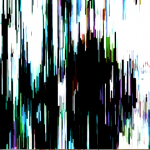
Optical feedback is a classic visual effect that results when an image capture device (a camera) is pointed at a screen that is displaying the camera’s output. This can create an image that looks like cellular automata/reaction-diffusion or fractals and can also serve as a method of image degradation through recursion.
Many video artists have used this technique to create swirling patterns as a basis for abstract videos, installations and music videos. Feedback can also be created digitally by various means including continually reading and drawing textures in a frame buffer object (FBO) but the concept is essentially the same. In this post I’m writing up a thought experiment for a project that would create the biggest optical feedback loop in the world.
Sample of analog video feedback:
Optical Feedback Loop from Adam Lucas on Vimeo.
Sample of video feedback (digital rendering from software):
I really enjoy the various forms of this effect from immediate feedback loops to “slower” processes like image degradation. Years ago, I did a few projects involving video feedback and image degradation via transmission, and this thought experiment combines those two interests. Lately, I’ve also been obsessed with really unnecessarily excessive, Rube Goldberg-like uses of technology, and this fits that interest pretty well. It’s like playing a giant game of Telephone with video signals.
While in residency at the Experimental Television Center in 2010, I was surrounded by cameras, monitors and 64 channel video routers. After a few sessions with playing with feedback on the Wobbulator, I drew up a sketch for making a large video feedback loop using all of the possible equipment in the lab…and a Skype feed for good measure. Here is that original sketch:

The eventual output of a large feedback loop ended up not looking the best because the setup was a little hacky and ended up losing detail very quickly due to camera auto adjustments and screens being too bright. The actual time delay through the whole system including Skype was still just a few frames. There was also several decades between equipment and a break between color and black & white feeds at certain points. I’ve returned to the idea a few times and I’ve wanted to push it a little further.
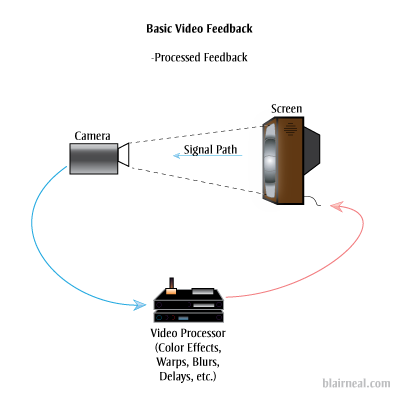
As a refresher, this is the most basic form of optical feedback, just a camera plugged into a screen that it is capturing.
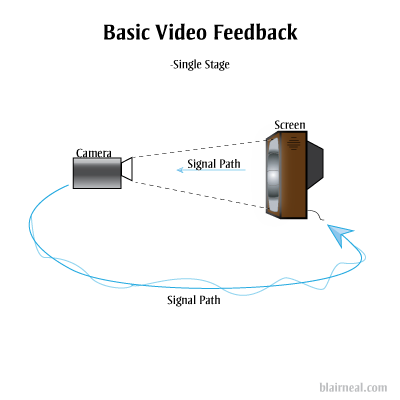
You can also add in additional processors into the chain that can effect the image quality (delays, blurs, color shifts, etc). Each of these effects will be amplified as they pass through the loop.
The above are the most common and straightforward techniques of optical feedback. They will generate most of the same feedback effects as the larger systems I’m proposing, generally with a shorter delay and less degradation. Doesn’t hurt to ask about what will happen if we add another stage to the feedback system:
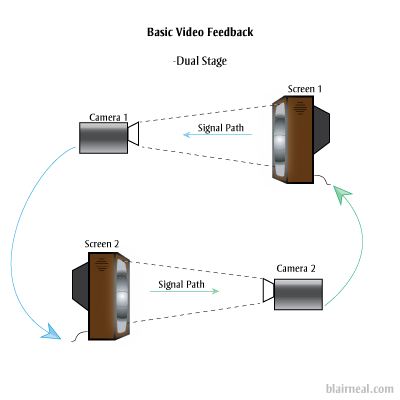
We’ll lose a little more image quality now that the original photons have been passed through twice as many pieces of glass and electronics. Let’s keep passing those photons around through more stages. You could put a blinking LED in front of one of the screens and have it send it’s photons through all the subsequent screens as they transform digitally, and electrically. The LED’s light would arrive behind it in some warped, barely perceivable fashion but it would really just be a sort of ghost of the original photons.
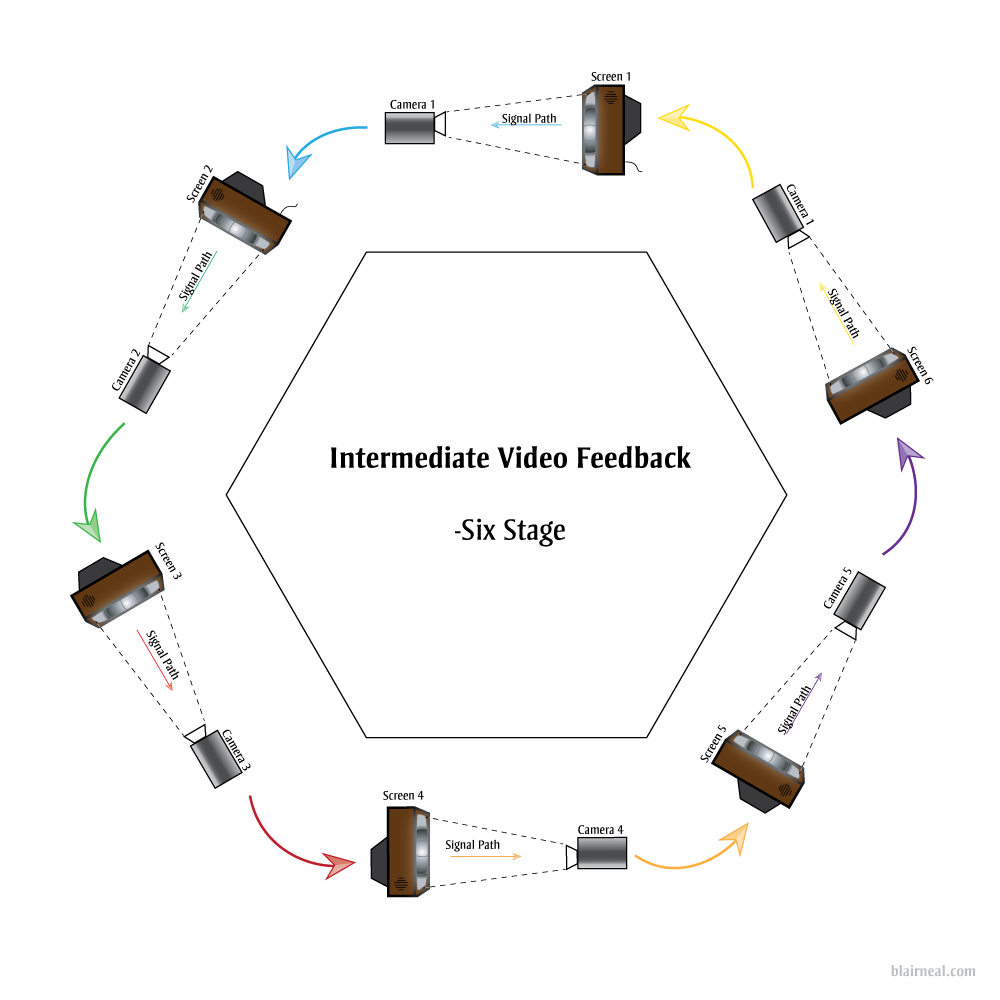
We can take the above example of a 6 stage video feedback loop and start working out what we might need to hit as many image and screen technologies as we can think of from the past 50 years. Video art’s Large Hadron Collider.
Click for detail
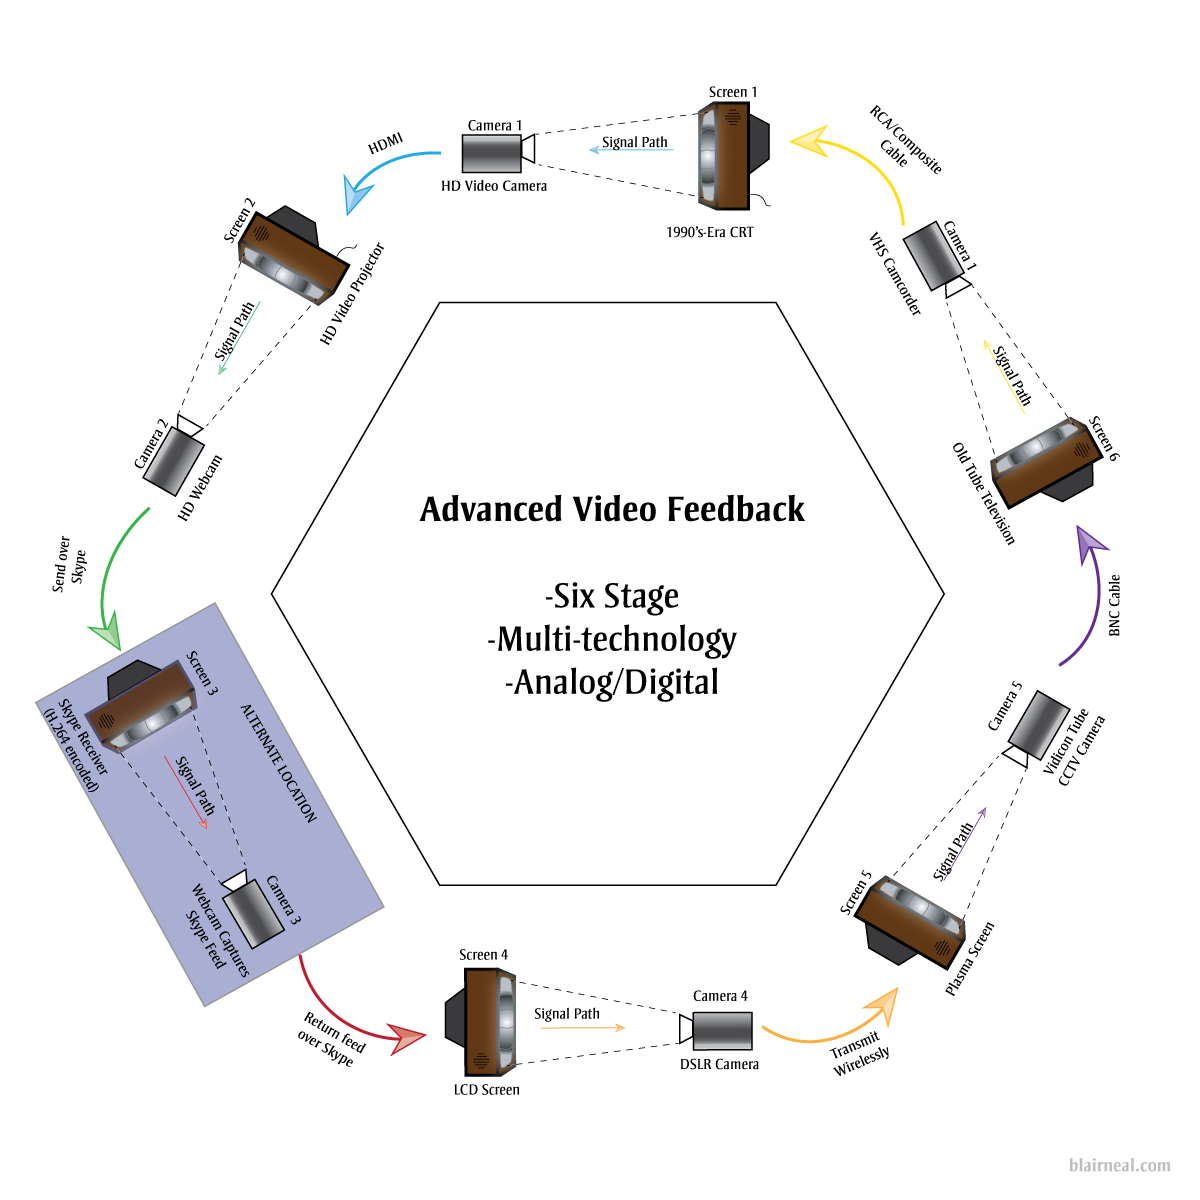
By hitting so many kinds of video processing methods we would get a video output that would be just a little delayed, and would create some interesting effects at certain points in the chain. By varying camera resolutions, camera capture methods, and analog versus digital technologies, we can bounce the same basic signal through all of these different sensor and cable types. The signal would become digital and analog at many different stages depending on the final technologies chosen. The digital form of the signal would have to squeeze and stretch to become analog again. The analog signal would need to be sampled, chopped and encoded into its digital form. Each of these stages would have their own conversions happening between:
- Video standards/Compressions (NTSC, PAL, H.264, DV, etc.)
- Resolutions/Drawing methods (1080p, 480p, 525 TV Lines)
- Voltages
- Refresh Rates
- Scan methods (CMOS, CCD, Vidicon Tube)
- Illumination methods (LED, Fluorescent Backlight, CRT)
- Wire types
- Pixel types
- Physical Transforms. (Passing through glass lenses, screens) etc etc
By adding in broadcast and streaming technologies like Skype, we can extend the feedback loop not only locally within one area, but also globally. One section of the chain can be sent across the globe to another studio running a similar setup with multiple technologies. This can continue being sent around to more and more stations as long as the end is always sent back to the first monitor in the chain.
A digital feedback or video processing step could also be added where several chains of digital feedback occur as well.
If you were able to create a system large enough, there could be so much processing happening for the signal itself to become delayed for a few seconds before it reaches the “original” start location. In this large system, you could wave your hand in between a monitor and camera, and get a warped “response” back from yourself a second or two later.
It’s interesting for me to consider what the signal would be at this point, after going through so many conversions and transforms. Is the signal a discrete moment as it passes from monitor to screen, or does it somehow keep some inherent properties as it fires around the ring?
Suggested Links:
http://softology.com.au/videofeedback/videofeedback.htm
February 21st, 2013
Guide to Camera Types for Interactive Installations
I just published an epic article over on Creative Applications detailing the use of different kinds of cameras in interactive installations. Check it out, and add any additional tips in the comments there!:
http://www.creativeapplications.net/tutorials/guide-to-camera-types-for-interactive-installations/
December 10th, 2012
Painterly Jitter


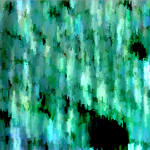
(Click for versions in their full 640 x 480 glory)Playing around with old code, feedback loops and Andrew Benson’s always fun optical flow shaders. Sometimes stills of unusual systems are nicer than the thing in motion…
2 Comments »